
Refinances jump as execution strategies and investor demand shift
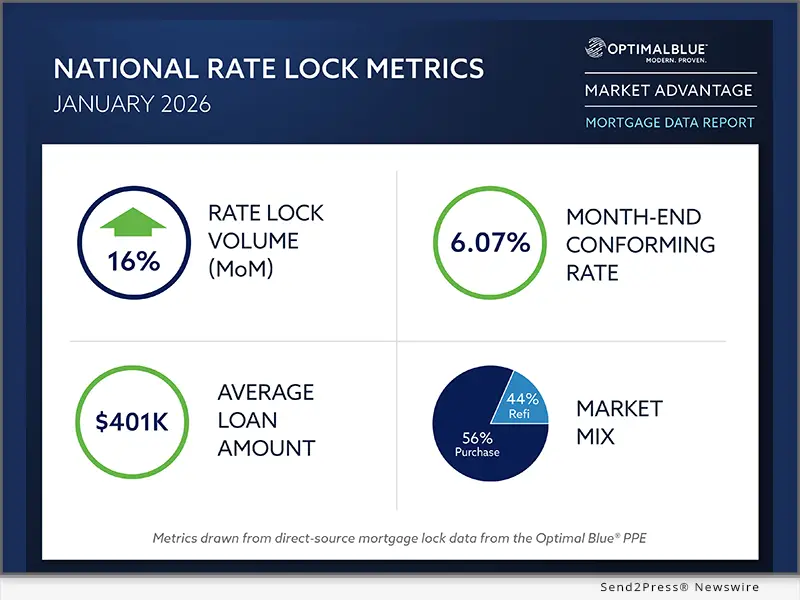
PLANO, Texas /CitizenWire/ -- Optimal Blue today released its January 2026 Market Advantage mortgage data report, showing a strong start to the year as falling rates drove a sharp increase in refinance activity. Total rate-lock volume rose 16% month over month (MoM) and finished January 36% higher year over year (YoY), led by a surge in rate-and-term refinances, which climbed 50% from December and more than 400% compared with January 2025. Cash-out refinance activity also increased, rising 11% MoM and 38% YoY. Purchase volume grew a modest 3% from December but remained down 5% from a year earlier, reflecting the slower response of purchase demand to changing rate conditions early in the year.
Mortgage rates moved lower across most products in January. The Optimal Blue Mortgage Market Indices (OBMMI) 30-year conforming fixed rate, the benchmark for CME Group's Mortgage Rate futures, declined 7 basis points (bps) to 6.07%. Jumbo rates fell 16 bps to 6.25%, VA rates declined 7 bps to 5.64% and FHA rates were largely unchanged at 5.99%. The average locked rate on the Optimal Blue PPE fell below 6% for the first time since August 2022.
"January's data shows just how quickly refinance demand can respond when rates move lower," said Mike Vough, senior vice president of corporate strategy at Optimal Blue. "It's been more than three years since the market last saw average rates with a '5 handle,' and crossing back below that level appears to have released meaningful pent-up refinance demand. Purchase activity is responding more gradually, which is typical this early in the year, but the shift in borrower behavior is clear."
On the secondary side, lenders adjusted execution strategies as pricing dynamics shifted and investor demand strengthened. Best-efforts-to-mandatory spreads increased for 30-year products, securitization activity increased and mortgage servicing rights (MSR) values rose despite declining benchmark rates, signaling a continued focus on balance sheet positioning and longer-term value.
"January's secondary market data reflects lenders positioning early for a potentially more active origination environment," said Vough. "Pricing trends were increasingly tied to eligibility rather than outright price give-ups, and agency MBS securitization reached its largest share since 2024. Meanwhile, rising MSR values and expanding investor participation point to a market focused on flexibility and long-term execution strategy as 2026 begins."
Key findings from the Market Advantage report, derived from direct-source mortgage lock and secondary market data, include:
VOLUME TRENDS AND MARKET COMPOSITION
* Sharp pickup in refis: Refinance activity surged in January as falling rates quickly translated into borrower demand. Rate-and-term refinance locks increased 50% MoM and were more than four times higher YoY. Cash-out refinances also gained momentum, rising 11% MoM and 38% YoY.
* Purchase activity lags: Purchase volume increased a modest 3% MoM but remained down 5% YoY. The slower response reflects the typical lag in purchase demand relative to rate movements, particularly early in the year.
* Non-QM share pulls back: Non-qualified mortgage share declined to 8% in January, down 160 bps from December but 70 bps higher YoY.
* VA gains momentum: VA lending captured a larger share of January activity as borrowers moved quickly to take advantage of lower rates, positioning VA portfolios for increased refinance-related payoffs as those loans move through the pipeline. VA loans accounted for 14% of locks, up 125 bps MoM and 212 bps YoY.
* PUD share retreats: Planned unit developments (PUDs) accounted for 28% of locks in January, down 95 bps MoM and 651 bps YoY.
RATES AND PRICING
* Rates edge down: Mortgage rates moved lower across most products in January. OBMMI for the 30-year conforming fixed rate declined 7 bps to 6.07%. Jumbo rates fell 16 bps to 6.25%, VA rates declined 7 bps to 5.64% and FHA rates were largely flat at 5.99%.
* MSR values tick higher: MSR values for conforming 30-year loans increased 2 bps to 1.16%, representing a 4.65 multiple, diverging from declining benchmark rates.
* Spreads widen on rate moves: Best-efforts-to-mandatory spreads increased for 30-year products in January, with the conforming 30-year spread widening 3 bps and the government 30-year spread increasing 8 bps. The conforming 15-year spread narrowed by 8 bps during the month.
* Pricing discipline persists: The share of loans sold at the highest price tier remained flat at 79%, while second-tier executions increased 200 bps to 13%, reflecting continued use of eligibility-based delivery strategies with less price concession.
CHANNEL AND EXECUTION
* Execution mix tilts to securitization: Lenders shifted hedged execution toward agency MBS in January, with securitization share increasing 300 bps MoM to 47%, the largest share since 2024.
* Aggregator and cash executions ease: Loan sales to bulk aggregators declined 100 bps MoM, while cash window executions also decreased 100 bps during the month.
* Investor participation continues to expand: The number of active investors increased to 14 in January, extending the expansion in investor participation that began late last year.
PRODUCT MIX AND BORROWER PROFILES
* Credit quality improves: Average credit scores increased for both cash-out refis (up 2 points) and rate-and-term refis (up 5 points). Credit scores also rose across all major products, including conforming (up 1 point), FHA (up 1 point) and VA (up 4 points) loans.
* Affordability metrics improve: Purchase debt-to-income (DTI) ratios declined across all loan types in January and fell 1 to 2 percentage points YoY. The share of first-time homebuyers also increased, rising to 45% of conforming loans and 70% of FHA loans.
* Loan amounts edge up: The average loan amount increased from $394,502 in December to $400,667. January loan amounts ranged from $868,498 in greater San Francisco to $316,638 in San Antonio. Loan-to-value ratios ranged from 70.21% in greater Los Angeles to 88.44% in San Antonio, with a national average of 80.06%.
To view the full January 2026 Market Advantage report, complete the free subscription form: https://engage.optimalblue.com/market-advantage.
Subscribers receive a report PDF each month with the latest data. Members of the press are eligible for special, advance access each month and should contact Leslie Colley to be added to the media list.
ABOUT THE MARKET ADVANTAGE REPORT
Optimal Blue issues the Market Advantage mortgage report each month to provide insight into U.S. mortgage trends and drivers of lending profitability. Data is sourced from the Optimal Blue PPE, which is used to price and lock more than one-third of all mortgages nationwide, and Optimal Blue's hedging and loan trading system, which supports approximately 40% of loans hedged and sold into the secondary market. As the leader in mortgage capital markets technology, Optimal Blue has a direct view of both origination and secondary market activity and the interconnectedness of the two. Unlike self-reported survey data, Optimal Blue's direct-source data accurately reflect the in-process loans in lenders' pipelines and secondary market executions. Visit Optimal Blue's website to subscribe to receive the free report each month.
Nothing herein shall be construed as, nor is Optimal Blue providing, any legal, trading, hedging or financial advice.
ABOUT OPTIMAL BLUE
Optimal Blue powers profitability across the mortgage capital markets ecosystem. As the industry's only end-to-end capital markets platform, our technology, data and integrations bridge the primary and secondary markets to help lenders of all sizes maximize performance - from pricing accuracy to margin protection and every step in between. Backed by over 20 years of proven expertise, our modern, cloud-native technology delivers the real-time automation, actionable data and seamless connectivity lenders need to navigate market volatility and scale for growth. To learn more about how Optimal Blue delivers measurable ROI, visit OptimalBlue.com.
Learn More: https://www2.optimalblue.com/
This version of news story was published on and is Copr. © 2026 CitizenWire™ (CitizenWire.com) - part of the Neotrope® News Network, USA - all rights reserved.
Information is believed accurate but is not guaranteed. For questions about the above news, contact the company/org/person noted in the text and NOT this website.