
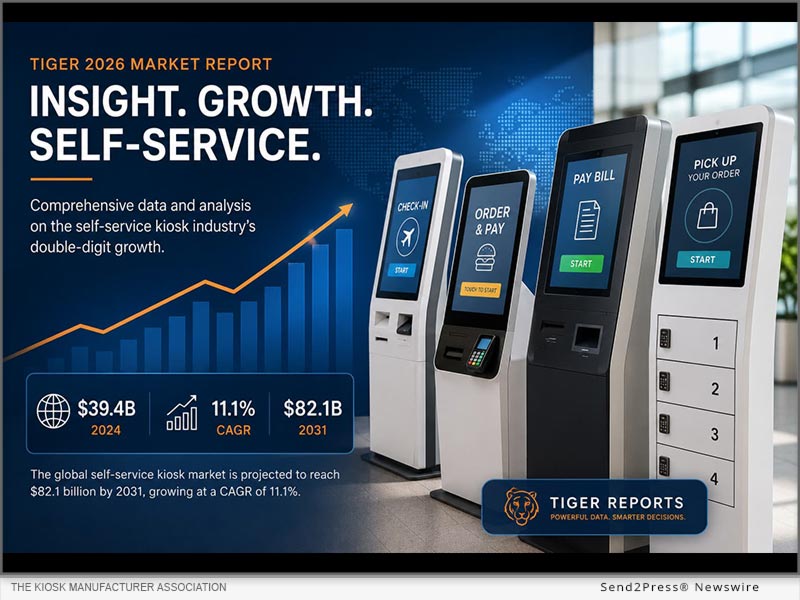
DENVER, Colo. /CitizenWire/ -- The self-service kiosk industry continues to expand at a fast pace, driven by evolving automation technology and growing customer acceptance of self-service in nearly all venues. Companies and organizations seeking to understand this technology-intensive sector now have a comprehensive and easy-to-understand resource, the Tiger 2026 Market Report, courtesy of the Kiosk Manufacturer Association.
The 35-page report sizes the global self-service kiosk market at about $39.4 billion in 2024, rising to roughly $82.1 billion by 2031, marking an 11.1 percent combined annual growth rate. The numbers are based on previous KMA reports, seven different industry reports, economic data, regulatory filings, reports from publicly traded companies and additional input from companies.
The report is designed to benefit kiosk industry companies in their business planning and those interested in investing in this fast growing trade.
"The weighted whole-market growth rate comes out to 11.1 percent CAGR, but that 'average' hides enormous spread between segments," said Craig Keefner, editor in chief of the report.
The report breaks the self-service kiosk industry into 14 segments which are modeled individually:
* EV charging
* Smart vending/micro markets
* Smart lockers
* Healthcare
* Unattended POS
* Self ordering for QSRs and fast casual restaurants
* Digital signage
* Check-in (hotel, airline, events)
* Self checkout
* Ticketing
* Financial services/ATMs
* Bill payment
* Crypto ATMs
* Others
The report also covers six adjacent verticals - parking, gaming, betting, DMV, self-storage and self-service carwashes - contributing more than $7 billion on top of core kiosk spend.
The segment-built model for the report prevents double counting of segments in the final total.
SEGMENT HIGHLIGHTS
Segment highlights include:
* EV charging kiosks come in at 31.5 percent CAGR, taking the category from about $0.85 billion to $5.8 billion by 2031.
* Smart vending and micro-markets grow at 16.5 percent CAGR, moving roughly from $1.5 billion to $4.5 billion.
* Unattended POS and smart lockers grow in the mid-teens, while self-checkout grows around 9 percent but remains the single largest line item at about $15.4 billion.
* At the other end of the growth curve, crypto ATMs are expanding at 4.2 percent, still cash-flow positive, but no longer a significant growth story.
THREE CONVERGING FORCES CONTINUE TO ANCHOR THE SELF-SERVICE KIOSK INDUSTRY:
* Faster EV-charging kiosk roll-out under the U.S. National Electric Vehicle Infrastructure (NEVI) government initiative and the European Union Alternative Fuels Infrastructure Regulation (AFIR) ruling.
* The operational pull of the European Accessibility Act (in force since June 28, 2025).
* The large language model (LLM) voice transition in quick-serve restaurant (QSR) drive-thru.
* Each of these forces is now expressed in segment-specific growth rates rather than averaged into a single whole-market number.
GROWTH SCENARIOS
The report also offers Bull/Base/Bear growth scenarios through 2031 for each of the 14 segments, with identified drivers such as EV charging build-out, accessibility mandates, services penetration and AI reliability.
One of the most unique benefits the report offers is a quantified understanding of the role service plays in kiosk revenue as opposed to hardware revenue. While hardware accounts for the lion's share of industry revenue, service is growing faster than hardware, commanding $12.4 billion in 2026. In addition to boosting revenue, service supports kiosk uptime, reliability and AI readiness.
RETROFIT VERSUS RIP-AND-REPLACE
One of the most practical outputs of the Tiger Report is a normalized five-year total cost of ownership (TCO) model that compares retrofit against rip-and-replace.
Retrofit cost comes in around $7,700 per kiosk over five years, versus roughly $18,000 for rip-and-replace, a 57 percent lower TCO. On a 1,000-unit fleet, that gap implies about $10.3 million of preserved capital by upgrading instead of starting over.
GEOGRAPHIC ANALYSIS
The report also includes geographic analysis of industry revenue. The United States commands about 37 percent of the global market at roughly $14.5 billion, followed by China at 17 percent ($6.8 billion), rest of Asia and Pacific at 14 percent ($5.5 billion), and core Europe (UK/Germany/France) at 13 percent ($5.1 billion). The rest of Asia Pacific is compounding fastest from a smaller base, while European growth is accelerated by the EU Accessibility Act moving from regulation to procurement driver.
The report comes in PDF form with 22 chapters and three appendices covering segment sizing, methodology, services, accessibility and adjacent verticals.
PURCHASE OPTIONS
The report is available in three versions:
* The Basic Report (35 pages): $495.00 (Launch discount 40 percent through July 31, 2026.)
* The Analyst Bundle buyers report includes an Excel market data pack, an analyst workbook, future updates through December 2026, and a voice AI in self-service brief. Price: $995.00 (Launch discount 40 percent through July 31, 2026.)
* The Enterprise License report includes a license to view TIG content, a one-hour live analyst briefing, and a one-year TIG Silver Sponsorship with weekly intelligence emails, with a launch price of $3,999.00 versus a stated package value of $8,200.00 through July 31, 2026.
To purchase these reports, click here - https://keefner3.gumroad.com/
ABOUT THE KIOSK MANUFACTURER ASSOCIATION:
The Kiosk Manufacturer Association, based in Denver, Colorado, is an association focused on documenting, educating and improving self-service for customers and employees through kiosks and information technology. https://kioskindustry.org/
Learn More: https://kioskindustry.org
This version of news story was published on and is Copr. © 2026 CitizenWire™ (CitizenWire.com) - part of the Neotrope® News Network, USA - all rights reserved.
Information is believed accurate but is not guaranteed. For questions about the above news, contact the company/org/person noted in the text and NOT this website.